


IT Service Analytics
Turn your ticket data into actionable measures
AI-powered analysis and dashboards that show not just numbers, but causes.
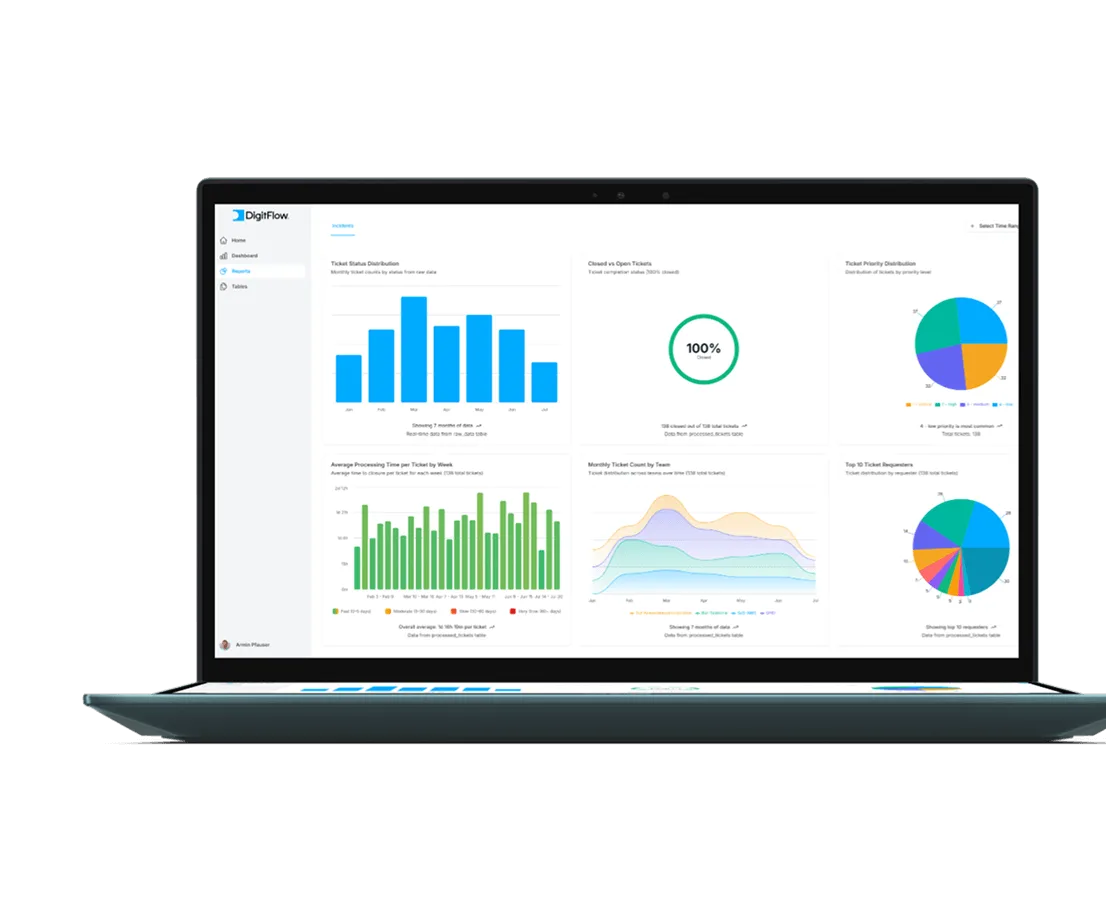
AI analysis
data processing
action recommendations

Challenges
The problem in everyday operations
Your ticket data contains valuable signals. In classic reports, however, the causes often remain invisible.
- Your report shows numbers, but no causes The ticket system provides statistics. But nobody tells you why lead times have increased in one category.
- Every analysis is a manual project Export, Excel, pivot tables, and in the end a report not everyone trusts. There is simply no capacity for regular, systematic analysis.
- Free text and attachments remain invisible Your tickets contain valuable information in free-text fields, screenshots, and emails. No classic report captures that.
- You steer by gut feeling instead of evidence Which services consume the most resources, where incidents accumulate, whether SLAs are met. The answers are in the data, but nobody has the time to extract them.
Solutions
What we deliver in practice
We turn existing ticket data into actionable knowledge: patterns, causes, and concrete next steps.
-
 Semantically analyze ticket data
- Free texts, attachments, and metadata are analyzed by content, even when tickets are categorized inconsistently.
-
 Cluster patterns and causes
- Recurring topics, incidents, and bottlenecks become visible, even when classic reports do not show them.
-
 Deliver dashboard and action plan
- Results are visualized with drilldown functionality and translated into concrete, prioritized recommendations.
What is hidden in your ticket data?
Schedule a free initial consultationIncident Radar
Know where your helpdesk loses time in ten days
Want to see what is in your ticket data before starting a larger project? Incident Radar delivers exactly that: an AI-powered analysis of your tickets with a concrete action plan in ten days. Together with our partner Verenburg Consulting. Fixed price, no risk.
Customer Success
From unclear tickets to clear management impulses
A company used Serviceware Processes for IT service management. Tickets contained free texts, attachments, and were inconsistently categorized, making reliable evaluation impossible. The goal was to make ticket content structurally usable and translate operational patterns into concrete improvement measures.
The solution
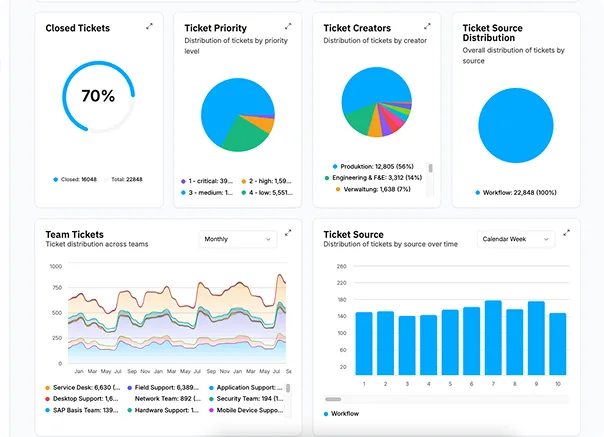
We semantically analyzed the ticket data, extracted topics and root cause indicators from free texts, grouped similar tickets through clustering, and built an interactive BI dashboard.
The result: For the first time, management could make data-driven decisions about which improvements to prioritize and where investments actually pay off.
Benefits
Why AI-based service analyses pay off for your IT team
Analytics & Reporting does not just deliver metrics. It reveals connections your teams can use directly in daily operations.
-

Argue based on data
- Instead of gut feeling, you have evidence. Numbers that are correct, connections that are visible.
-

Detect incidents earlier
- You see where problems accumulate and where your resources really go before things escalate.
-

Staff planning based on real data
- Who handles what, how long, and at what quality? The answers come from your own ticket data.
-

Identify SLA deviations in time
- Not just in the monthly report, but in real time.
-

Prioritized levers
- You see which measures will have an impact first and where the next step is worth taking.
-

Better decisions
- Management and teams work with a shared view of services, workload drivers, and priorities.
Approach
In four steps from ticket data to actionable measures
Kickoff workshop
You explain your goals and current bottlenecks.
Data analysis
We ingest your ITSM data and perform the AI-powered analysis.
Dashboard
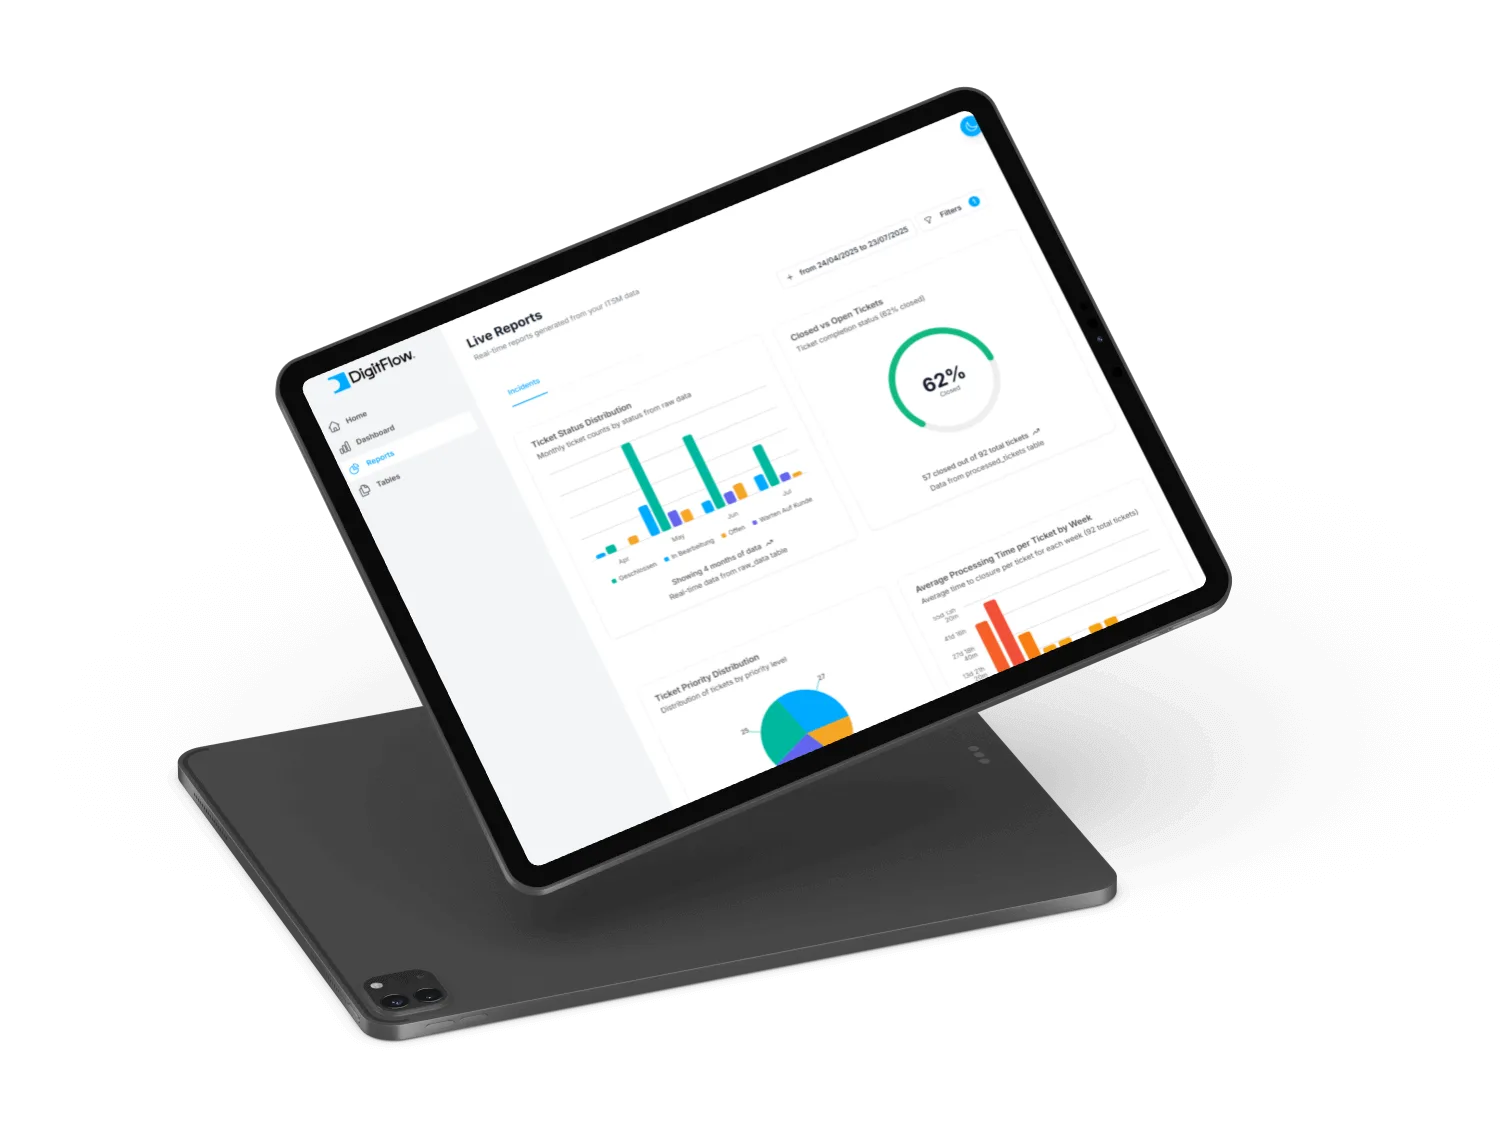
Results are visualized on an intuitive dashboard, integrated into your infrastructure.
Action recommendations
Together we develop next steps and concrete measures.
From findings to implementation
When it is clear where patterns, bottlenecks, or manual efforts arise, automation, knowledge management, or document analysis can follow.
Free initial consultation
Let's talk about your ticket data
You typically see the first patterns after a few weeks. The finished dashboard with drilldown functions and recommendations follows afterwards.